Power of Monitoring and Management with Amazon CloudWatch


Introduction:
In this Blog, I will Explain the Cloud Watch and its uses in AWS and How it will be useful in AWS.
In the ever-evolving landscape of cloud computing, effective monitoring and management are crucial for ensuring the optimal performance, reliability, and security of your applications and infrastructure. Amazon CloudWatch, a comprehensive monitoring and management service from Amazon Web Services (AWS), empowers businesses to gain deep insights into their cloud resources.
What is Amazon CloudWatch?
Amazon CloudWatch monitors your Amazon Web Services (AWS) resources and the applications you run on AWS in real-time. You can use CloudWatch to collect and track metrics, which are variables you can measure for your resources and applications.
The CloudWatch home page automatically displays metrics about every AWS service you use. You can additionally create custom dashboards to display metrics about your custom applications and display custom collections of metrics that you choose.
You can create alarms that watch metrics and send notifications or automatically make changes to the resources you are monitoring when a threshold is breached.
Accessing Cloud Watch:
Accessing Amazon CloudWatch involves using the AWS Management Console, AWS Command Line Interface (CLI), or AWS SDKs/APIs
How Amazon CloudWatch works:
Amazon CloudWatch is a metrics repository. An AWS service—such as Amazon EC2—puts metrics into the repository, and you retrieve statistics based on those metrics. If you put your custom metrics into the repository, you can retrieve statistics on these metrics as well.
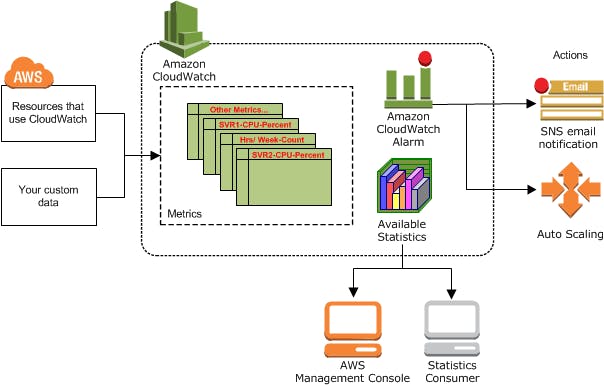
You can use metrics to calculate statistics and then present the data graphically in the CloudWatch console.
You can configure alarm actions to stop, start, or terminate an Amazon EC2 instance when certain criteria are met. In addition, you can create alarms that initiate Amazon EC2 Auto Scaling and Amazon Simple Notification Service (Amazon SNS) actions on your behalf.
Amazon CloudWatch concepts:
Amazon CloudWatch is a comprehensive monitoring and observability service provided by AWS (Amazon Web Services). It allows users to collect and track metrics, collect and monitor log files, and set alarms. Here's a simplified overview of how Amazon CloudWatch works, along with an example:
1. Metrics Collection:
CloudWatch collects metrics from various AWS services, custom applications, and resources. Metrics are numerical data that represent the performance of your applications and infrastructure.
Example: For an Amazon EC2 instance, CloudWatch can collect metrics like CPU utilization, network traffic, and disk I/O.
2. Data Storage:
The collected metrics are stored in CloudWatch as time-ordered data points. These data points form the basis for generating graphs, setting alarms, and conducting analysis.
Example: CPU utilization data points for an EC2 instance are stored over time.
3. Dashboard and Visualization:
Users can create dashboards to visualize the metrics using the CloudWatch console. Dashboards allow for a quick overview of the health and performance of resources.
Example: A dashboard might display the CPU utilization and network traffic of multiple EC2 instances in a single view.
4. Alarms and Notifications:
Alarms can be set based on thresholds defined by users. When a metric breaches a specified threshold, CloudWatch triggers alarms.
Example: An alarm is set to notify when the CPU utilization of an EC2 instance exceeds 80% for a specified duration.
5. Automated Scaling:
CloudWatch can be integrated with AWS Auto Scaling to automatically adjust the number of instances based on metrics, ensuring that the application scales to meet demand.
Example: If CPU utilization is consistently high, Auto Scaling may automatically launch additional EC2 instances to handle increased load.
6. Logs and Log Insights:
CloudWatch Logs allows users to centralize logs from various AWS services and applications. It supports log aggregation, storage, and analysis.
Example: Logs from an application running on EC2 instances can be sent to CloudWatch Logs for analysis and troubleshooting.
7. Integration with AWS Services:
CloudWatch integrates with other AWS services such as AWS Lambda, Amazon S3, and more, allowing users to automate responses and perform advanced analytics.
Example: CloudWatch Events can trigger a Lambda function in response to a specific event, automating actions based on monitoring data.
Example Scenario:
Consider an e-commerce website hosted on AWS. Using CloudWatch, you can monitor key metrics such as the number of requests, server response time, and database performance. If the number of requests exceeds a predefined threshold, an alarm can trigger an AWS Lambda function to automatically scale up the web server fleet using AWS Auto Scaling. Simultaneously, CloudWatch Logs can be used to analyze application logs and identify potential issues affecting user experience.
This example showcases the versatility of Amazon CloudWatch in monitoring, alerting, and automating responses to ensure the optimal performance of cloud-based applications.
Conclusion:
Amazon CloudWatch stands as a cornerstone in the AWS ecosystem, redefining how businesses monitor, manage, and optimize their cloud resources. Over the past year, CloudWatch has proven itself as an indispensable tool for organizations of all sizes, providing a holistic and real-time view of the health and performance of their AWS environments.